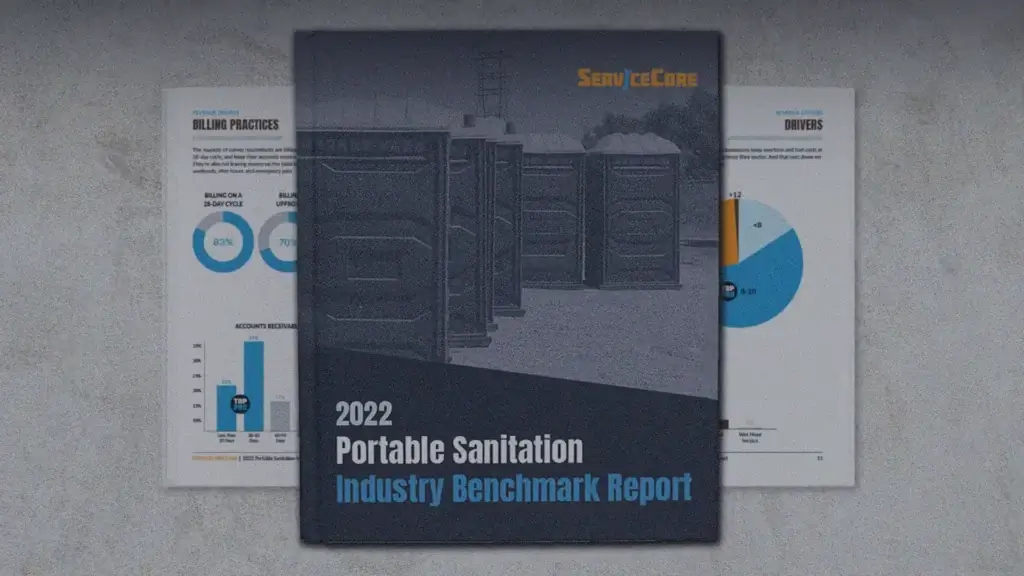
2022 Portable Sanitation Industry Benchmark Report
Until now, the portable sanitation industry has lacked benchmarking data to help operators understand how their business compares to others. In the past, you’ve probably talked shop with operators at conferences and on Facebook groups, but those outlets lack objective data on the portable sanitation industry as a whole. That’s why we’ve created this Portable Sanitation Industry Benchmark Report.
In the last year, we’ve seen a rapid trend of operators modernizing their business practices, and the benchmarks from our inaugural report reflect that. The data shows that the most profitable portable sanitation businesses are improving their processes and upgrading their tools.
With this report, our goal is to make it easy for you to see how your business compares to others, and provide insights into where your business could make improvements.
Sure, maybe you’re making great profits and gaining tons of customers. But, if you don’t know how the competition is running their businesses, do you really know if you’ve got a winning business? That’s where ServiceCore comes in.
We’ve spent the past few months surveying hundreds of portable restroom operators from around the United States.
Enter the 2022 Portable Sanitation Industry Benchmark Report.
Before you can improve your business performance, you have to measure it. But with the lack of tools out there, knowing which metrics to focus on has never been more challenging. Fortunately, with our benchmark report, you can uncover the insights you need to measure your portable sanitation business’s success.
Who’s setting the benchmarks?
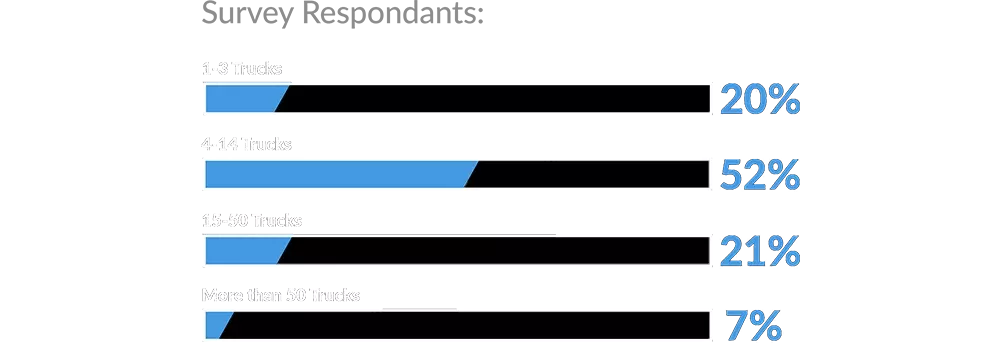
Over the past few months, ServiceCore surveyed portable sanitation operators all over the United States on all aspects of their businesses, and the data in this report depicts 292 individual responses. For each category, we’ve highlighted what the “Top PROs” are doing. “Top PROs” are defined as portable sanitation businesses that have more than a 20% profit margin. Below are the demographics of the survey respondents:

Average years in business: 8.5


What will I learn from this report?
- The 6 measurable benchmarks of operations.
- What revenue category drove the most profits in 2022.
- How PROs have changed their billing practices.
- How the supply chain improved in 2022.
- What growth will look like in 2023
We hope this report will help you compare how your portable sanitation business is doing compared to others. We’d like to thank all of the operators that took the time to fill out our benchmark survey. Without you this report wouldn’t have been possible! To download the full report, click here.